Wireshark Tutorial:
Your Complete Guide to Network Traffic Analysis for Beginners in 2025
Introduction: Why Network Traffic Analysis Matters in 2025

Network traffic analysis is more essential than ever for professionals, students, and anyone curious about how digital communication works. Whether troubleshooting a slow internet connection, hunting down security threats, or simply learning about network protocols, understanding what moves through the wires is foundational. Wireshark stands out as the world’s most popular free tool for this purpose.
Wireshark lets you see inside the invisible world of network packets, revealing everything from web browsing data to suspicious activity. This guide welcomes beginners, showing how to download, set up, and use Wireshark for everyday network traffic analysis in 2025.
What is Wireshark? An Introduction for First-Timers
Wireshark is an open-source network protocol analyzer. It captures packets—tiny data segments—moving across your network, decodes them, and helps you interpret what’s happening beneath the surface. Originally designed for experts, Wireshark now offers a welcoming interface for newcomers and seasoned analysts alike.
With Wireshark, you can:
-
Diagnose network issues.
-
Analyze performance bottlenecks.
-
Spot abnormal or malicious traffic.
-
Learn protocols like TCP, UDP, HTTP, DNS, and many others.
-
Gain hands-on skills for IT roles, cybersecurity, and research.
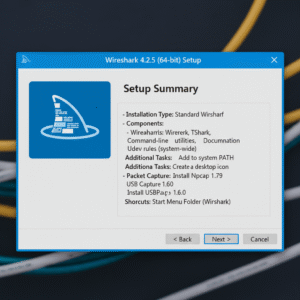
Installing Wireshark: Step-by-Step Setup for Beginners
Downloading Wireshark
Visit the official Wireshark website and choose your operating system—Windows, macOS, or Linux. Always download from the official source to ensure you get the latest, safest version.
Windows
-
Download “Windows x64 Installer” from the website.
-
Run the installer, following the on-screen prompts.
-
During installation, accept the “Npcap” packet capture driver (required for packet sniffing).
macOS
-
Download the
.dmginstaller or use Homebrew:brew install --cask wireshark. -
Follow installation prompts, and grant permissions for network access.
Linux (Ubuntu/Debian)
Open a terminal and run:
sudo apt update

sudo apt install wireshark

sudo usermod -aG wireshark $USER
Log out and back in to access network interfaces for packet capture.
Initial Setup Tips
-
Launch the application and choose a compatible capture interface (usually Ethernet or Wi-Fi).
-
Configure basic preferences—theme, font size, and capture buffer size—for best performance.
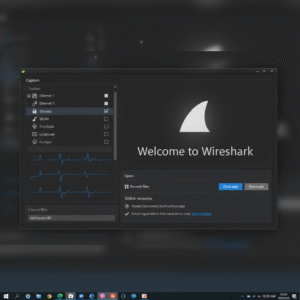
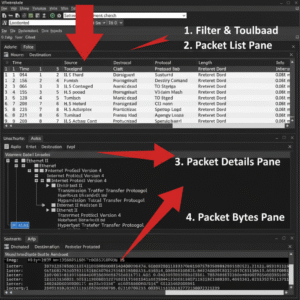
Exploring the Wireshark Interface
When you launch Wireshark, you’ll see:
-
Interface List: Shows available network devices (Ethernet, Wi-Fi, VPN adapters).
-
Packet List: The top pane, displaying live-captured packets with columns like Number, Time, Source, Destination, Protocol, Length, Info.
-
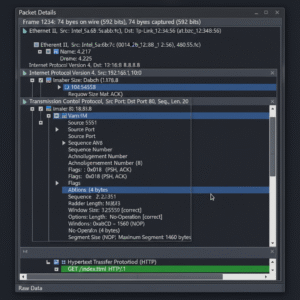
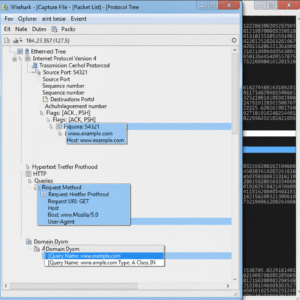
Packet Details: The middle pane breaks each packet down into protocol layers (Ethernet, IP, TCP/UDP, Application).
-
Packet Bytes: The bottom pane, showing raw data in both hexadecimal and ASCII.
-
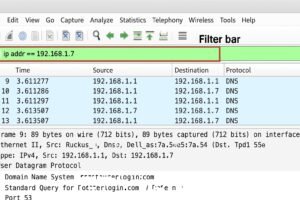
Filter Bar: Where you enter filters to view specific traffic.
These panes work together to make sense of vast amounts of data. Try clicking on any row—details instantly update below.
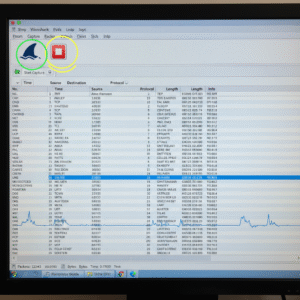
Getting Started: Capturing Packets in Wireshark
Starting Your First Packet Capture
-
Select the desired network interface (the one actively sending/receiving packets).
-
Click the blue “shark fin” button to begin capturing.
-
Run internet activities—browse, download, send emails—to generate live network packets.
Wireshark captures everything passing through the network interface. You can watch the packet list start populating in real time.
Stopping and Saving a Capture
-
Click the red square “Stop” button to halt packet collection.
-
Save your session with
File > Save As. Wireshark’s.pcapngformat preserves all packet data and lets you share sessions for troubleshooting or experimentation.
Packet capture files are essential for learning and collaboration.
Understanding Packets: The Language of Your Network
Packets are the basic units of network data. Each packet contains source/destination addresses, protocol info, and the payload (the actual content, from webpage requests to video streams).
Key Columns in Packet List
| Column | Description |
|---|---|
| No. | Sequential number for each packet |
| Time | Time since capture start |
| Source | Where the packet originated (IP/MAC) |
| Destination | Where the packet is headed |
| Protocol | Type (TCP, UDP, HTTP, DNS, etc.) |
| Length | Size of the packet |
| Info | Brief summary or action |
By clicking any packet, you can expand to see:
-
Ethernet/IP headers: Layer 2/3 details.
-
Transport Layer: TCP or UDP info (ports, sequence/ACK numbers).
-
Application Layer: HTTP requests, DNS queries, etc.
-
Raw Data: Byte-by-byte payload viewing.
Wireshark Filters Explained: Filtering Traffic
Wireshark’s filters help you navigate overwhelming traffic and zero in on what matters. There are two main types:
1. Capture Filters
These are set before you begin capturing. They limit the data Wireshark collects, useful for targeting particular addresses, protocols, or ports.
Example:
Capture only HTTP traffic:
tcp port 80
2. Display Filters
Apply after the capture is finished to show only selected packets in the interface.
Common display filters:
-
Only show packets from a specific IP:
ip.addr == 192.168.1.10 -
Only TCP packets:
tcp -
Show traffic to a web server:
http.request -
Exclude DNS packets:
!dns -
Show packets bigger than 1kb:
frame.len > 1000
Filters make it possible to find security anomalies (like scanning tools), malicious traffic (such as suspicious domains), or troubleshoot errors quickly.
Tips:
-
Combine filters:
ip.addr == 192.168.1.10 && tcp -
Use the filter field’s autocomplete as a guide.
Practical Use Cases for Beginners
Network Troubleshooting
Wireshark shines for diagnosing slow or unreachable network connections. Use filters to monitor error packets, retransmissions, and latency. You can instantly spot dropped packets, protocol mismatches, or path delays between devices.
Security Analysis
Beginners use Wireshark to spot unauthorized devices, detect suspicious connections, and analyze attack attempts. For instance:
-
Look for brute-force login attempts through repeated failed TCP handshakes.
-
Catch malware traffic by monitoring unusual DNS requests or external IP destinations.
-
Investigate phishing attempts by following HTTP streams with sensitive payloads.
Learning Protocols
Wireshark is a playground for learning how TCP establishes connections (SYN, ACK), how DNS resolves websites, or how SSL/TLS encrypts data. Scroll through protocol layers to see the mechanics in action.

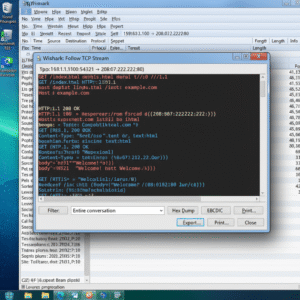
Following Streams: Analyze Complete Conversations
Packets are often just fragments of a bigger conversation. Wireshark’s stream-following features allow you to reconstruct sessions, from entire downloads to chat logs over TCP.
Steps:
-
Right-click on a packet.
-
Select “Follow TCP Stream” or “Follow UDP Stream.”
-
See a complete readable transcript of the data exchange.
This is especially helpful for inspecting web requests, email logins, and file transfers.
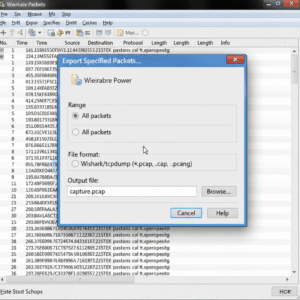
Saving and Exporting Your Work
The ability to save and export your captures is vital for sharing results, collaborating, or continuing analysis later.
-
Save as
.pcapngfor maximum detail and compatibility. -
Export selected packets (File > Export Specified Packets) to focus your analysis.
-
Use “File > Export Packet Dissections” for reports in CSV or TXT format—handy for research or incident documentation.
Double-clicking old capture files reopens them directly in Wireshark, preserving filters and views.
Decoding Common Protocols in Wireshark
TCP (Transmission Control Protocol)
Tracks connections, handshakes, retransmissions, and orderly delivery. Use filters like:
-
tcp.flags.syn == 1to show SYN packets (handshakes). -
tcp.analysis.retransmissionfor retransmitted packets.
UDP (User Datagram Protocol)
Focuses on direct, fast delivery—usually for apps like DNS and streaming.
HTTP and HTTPS
Monitor web activity. See request/response headers for HTTP; HTTPS traffic is encrypted and mainly shows only connection metadata.
DNS
Tracks domain queries and responses.
-
Filter:
dns
ICMP
Used for ping and traceroute.
-
Filter:
icmp
Each protocol has built-in decoding, so you can see payloads, headers, and important flags.
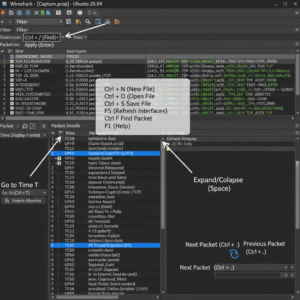
Essential Wireshark Shortcuts and Commands
Efficiency matters as you grow familiar with Wireshark. The following shortcuts are particularly helpful:
| Shortcut | Action |
|---|---|
| Ctrl+E | Start/Stop packet capture |
| Ctrl+S | Save capture file |
| Ctrl+O | Open capture file |
| Ctrl+F | Search/filter packets |
| ↓ / ↑ | Navigate through packet list |
| Enter | Expand/collapse tree item |
| Backspace | Move up in protocol tree |
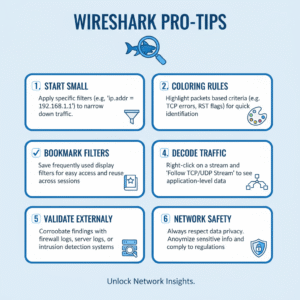
Tips for Effective Packet Analysis
-
Start Small: Filter by protocol, address, or port to build confidence.
-
Use Coloring Rules: Wireshark automatically highlights error packets, handshakes, and more for rapid analysis.
-
Bookmark Filters: Save commonly used filters for repeated troubleshooting.
-
Decode Application Traffic: Follow streams to tie network events to real use cases.
-
Validate with External Logs: Pair Wireshark findings with router logs or firewalls for comprehensive results.
-
Network Safety: Only capture on networks you’re authorized to inspect. Respect privacy and local laws.
Conclusion: Becoming a Network Detective with Wireshark
Wireshark is much more than a technical tool—it’s an interactive playground for learning, security, and hands-on troubleshooting. As outlined, there’s no mystery too deep: from novice packet inspection to advanced protocol analysis, Wireshark gives every user the power to understand their network.
Start with the basics, leverage filters, try out streams and exports, and remember to practice often. Over time, you’ll be able to spot performance issues, decode security threats, and master protocols in any environment. Every successful network detective uses Wireshark as a central tool—now, so can you.